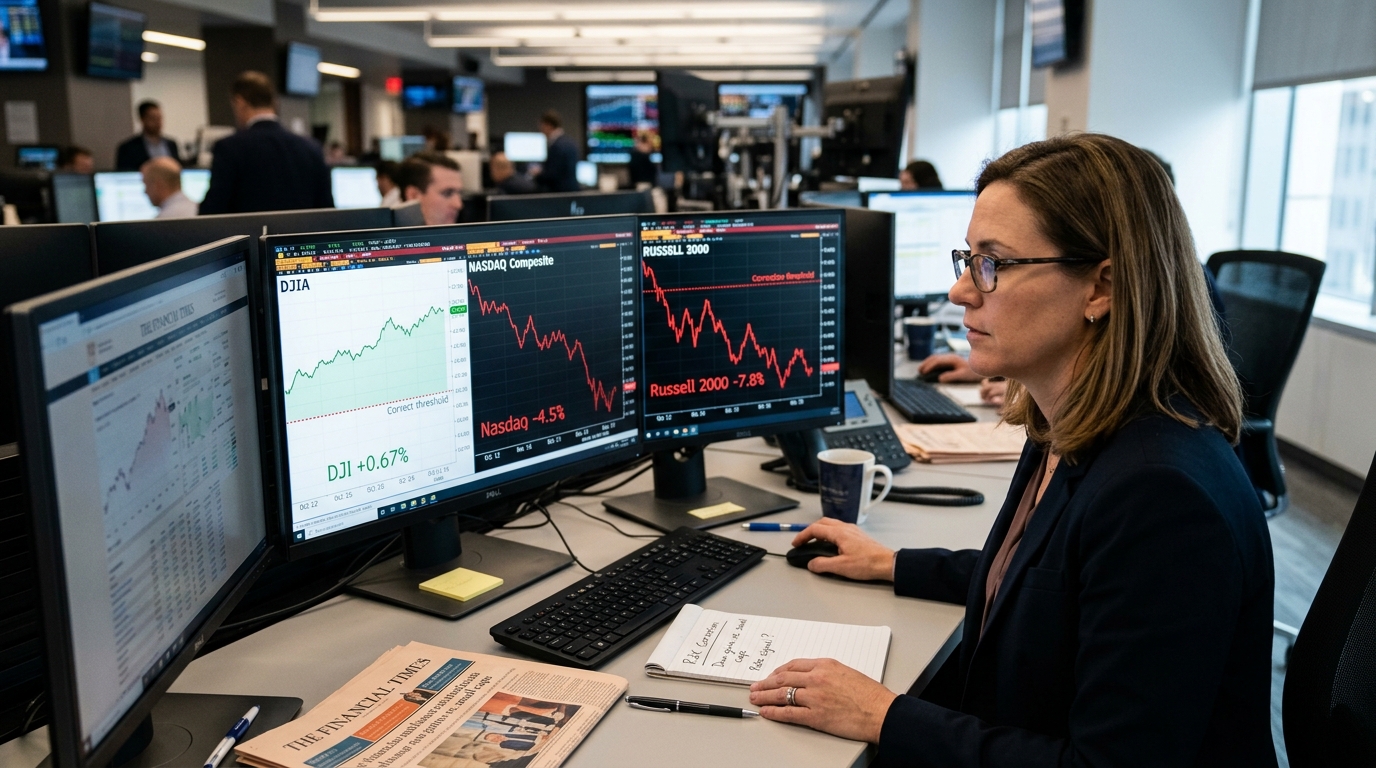
The headline from last week was the Dow’s second consecutive weekly gain. The more useful one is buried inside the Russell 2000’s correction.
The Dow Jones Industrial Average rose 0.67% for the week ended October 16, marking its second straight week of gains. The Nasdaq, meanwhile, had a four-week winning streak snapped, tumbling 4.5% over the week’s five sessions. And the Russell 2000, which tracks small-cap stocks, fell into correction territory on Wednesday, ending the day down about 11% from its August 14 record close. Three indexes. Three different verdicts on the same economy.
What Actually Moved
For the week, the Nasdaq Composite lost 4.48% while the Dow gained 0.67%. The Russell 2000 fared even worse than the Nasdaq by week’s end: the small-cap index lost 85.61 points, or 3%, over the week.
The Dow’s resilience was not random. On Thursday, the Dow jumped 556 points, or 1.08%, while the Nasdaq barely moved. Energy and consumer staples carried the blue chips. The Dow is not telling you the economy is strong. It is telling you capital rotated away from tech and into companies with pricing power and tangible cash flows.
Why It Happened
The proximate cause for the Nasdaq’s collapse is well-covered: AI-linked chip stocks cracked on doubts about the durability of AI capital spending. Intel fell 5.8% and Micron Technology lost 5.6%. But the Russell 2000’s correction has a different and more durable cause.
The 10-year Treasury yield stood at about 5.10% on October 15, 2026. That move is punishing small caps disproportionately. Goldman Sachs Asset Management has argued that small caps are structurally more rate-sensitive: Russell 2000 companies carry over twice the leverage of large caps, and about 32% of their debt is floating-rate, versus 6% for S&P 500 constituents. When the 10-year trades above 5%, refinancing costs rise faster for the companies inside IWM than for anything in the Dow.
IWM is struggling in part because of the balance sheets beneath the wrapper: roughly 40% of the companies inside the Russell 2000 are unprofitable, according to widely cited market analysis. Unprofitable companies dependent on external financing feel rate hikes before they show up in any survey data.
What the Market May Be Missing
BCA Research made an interesting note mid-week: strategists observed that smaller firms are “not yet feeling the bite from higher rates,” with labor availability and inflation remaining the top two concerns among small business owners, and no appreciable increase in businesses reporting interest rates as their number one problem. That sounds reassuring. It is not. The impact of rising rates showed up with a lag in 2021 and 2022, and small businesses may only be starting to feel the effect of rising yields. The equity market is pricing the lag, not the current survey.
The FOMC meets October 27 to 28. Futures implied roughly a 15% to 16% probability of a hike at that meeting as of Friday. But the median Fed projection from the September meeting implied one more 2026 hike, which left room to pause in October and raise again in December. If that path holds, the Russell 2000’s correction is not a buying opportunity. It is the opening chapter.
Where It Shows Up
IWM is the clearest instrument for this read. The Russell 2000 ETF posted about $3.3 billion in outflows in a single week in late September, according to figures circulated by market data trackers. That was before the correction was even official. The outflow pace since August suggests institutional money already made its judgment.
The Dow’s sector composition is the opposite side of the same trade. Chevron, McDonald’s, and Walmart are not rate-immune, but their debt structures and free cash flow profiles look entirely different from the unprofitable small caps being reset in IWM.
Risks and Counterpoints
The bull case for small caps is that valuations, after a roughly 11% drop from August highs, are compressing toward genuinely attractive levels relative to large caps. If the Fed holds in October and December inflation data cooperates, floating-rate pressure could ease quickly. The Nasdaq’s AI-driven selloff is also separable from the small-cap rate story; a stabilization in chip stocks would not mechanically rescue IWM.
What to Watch Next
The October 28 FOMC statement is the first gate. Chair Warsh’s press conference language on December will matter more than the October decision itself. Watch the 10-year yield around 5.10%: the benchmark yield eased back to that level by October 15 after trading above 5.25% earlier this month. But above 5%, borrowing costs still bite, and the next few readings will decide whether this is a pause or a turn. For the Russell 2000, that distinction is not academic. It is the difference between a correction and something longer.